So is the dream of a young man called Dan to create a true (as best as we can within the confines of SM) Level Playing Field league starting to come true ?
Here is some Div 1 evidence over the first five (5) seasons that this might be starting to take shape ...
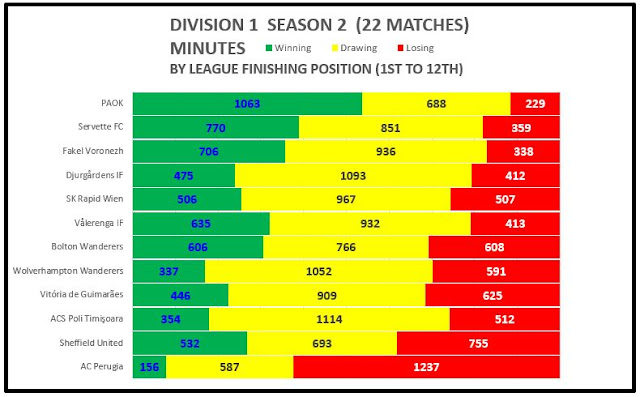
Each chart represents the minutes across the 22 league games per season each team was either winning, drawing or losing their matches.
Teams are ranked 1 thru 12 in final finishing order
Comments are focused on the minutes winning ...
Season 1
First season, many different strategies adopted ... quite a range across the division
Season 2
Second season, quite a disparate set of data ... monster season for PAOK ... Frank Hirst experiment in Perugia, the long game, is playing out as anticipated ...
Season 3
Season 4
Season 5
What does this all mean ? I have got absolutely no idea 😒
Well maybe it is starting to show the league is ... perhaps ... level 😤
What say you the gentry of the league ?
Signing off from the Moyes bunker at Molineux
Mike T


Good stuff, Mike.
ReplyDeleteI suspect that what it shows is that after four seasons the cream has mostly risen to the top, the wholesome full fat milk is mostly in D2, semi-skimmed in D3, and fully skimmed in D4?